
Nelson Rules
Nelson rules are a method in process control of determining if some measured variable is out of control (unpredictable versus consistent). Rules, for detecting "out-of-control" or non-random conditions were first postulated by Walter A. Shewhart [1] in the 1920s. The Nelson rules were first published in the October 1984 issue of the Journal of Quality Technology in an article by Lloyd S Nelson.[2]
The rules are applied to a control chart on which the magnitude of some variable is plotted against time. The rules are based on the mean value and the standard deviationof the samples.
| Rule | Description | Chart Example | Problem Indicated |
|---|---|---|---|
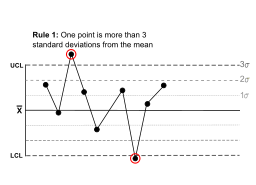
| One point is more than 3 standard deviations from the mean. | One sample (two shown in this case) is grossly out of control. | ||
| Nine (or more) points in a row are on the same side of the mean. |  | Some prolonged bias exists. | |
| Six (or more) points in a row are continually increasing (or decreasing). |  | A trend exists. | |
| Fourteen (or more) points in a row alternate in direction, increasing then decreasing. |  | This much oscillation is beyond noise. Note that the rule is concerned with directionality only. The position of the mean and the size of the standard deviation have no bearing. | |
| Two (or three) out of three points in a row are more than 2 standard deviations from the mean in the same direction. |  | There is a medium tendency for samples to be mediumly out of control. The side of the mean for the third point is unspecified. | |
| Four (or five) out of five points in a row are more than 1 standard deviation from the mean in the same direction. |  | There is a strong tendency for samples to be slightly out of control. The side of the mean for the fifth point is unspecified. | |
| Fifteen points in a row are all within 1 standard deviation of the mean on either side of the mean. |  | With 1 standard deviation, greater variation would be expected. | |
| Eight points in a row exist with none within 1 standard deviation of the mean and the points are in both directions from the mean. |  | Jumping from above to below whilst missing the first standard deviation band is rarely random. |
The above eight rules apply to a chart of a variable value.